Study “Media Bias” – Media usage behavior in comparison

What do you think, do people from the marketing and media industry, so-called Ad People (to which the author of this article also belongs), have a different media usage behavior than the rest of the Swiss population? If so, do Ad People therefore misjudge general usage behavior? We wanted to know exactly and, together with IGEM and in cooperation with WEMF, conducted the “Media Bias” study on the media usage of Ad People and their assessment of general media usage behavior (study for download below in the article).
Before we go into the study results, we would like to test your estimation accuracy regarding general media usage here. Answer the question for yourself first and then click on the respective Video:
What percentage uses Facebook, LinkedIn or TikTok?
What do people watch more: linear or time-shifted TV?
Classic Radio or Spotify, what do people listen to more?
And? Estimated correctly? Then congratulations! If not, don’t worry, you are not alone. In the survey for the study, the Ad People were on average 10 percentage points off with their estimate. What may not sound like much at first can make a big difference to the individual medium. Siri Fischer, Managing Director of IGEM, sees it the same way:
Although we expected a deviation in the assessment and usage of the professionals, we were surprised that it is so large for individual media genres.
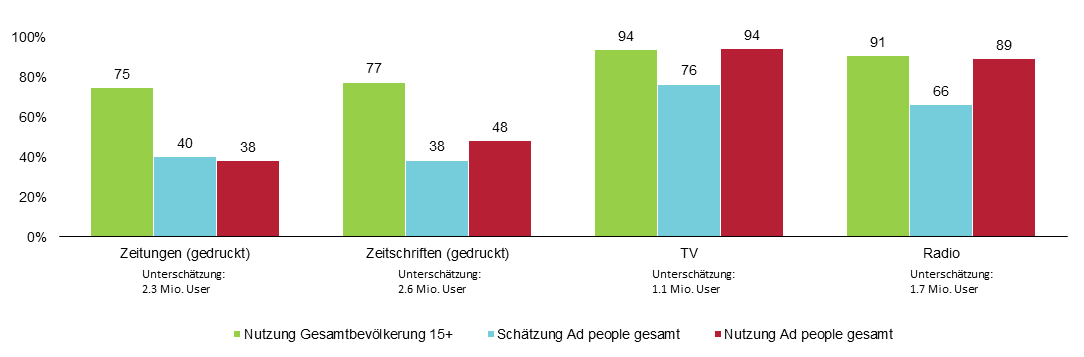
Take, for example, the differences in the Print area (Graphic 1). Ad People not only use Print significantly less, they underestimate the usage among the population by a full 39 percentage points for magazines and 35 percentage points for newspapers. Applied to the population, one could say that the professionals underestimate Print usage by approximately 2.6 million users. For Radio, it’s about 1.7 million users (25 percentage points) and for TV, it’s still about 1.1 million (17 percentage points).
Graphic 1: Usage and estimation – classic media
User shares in %
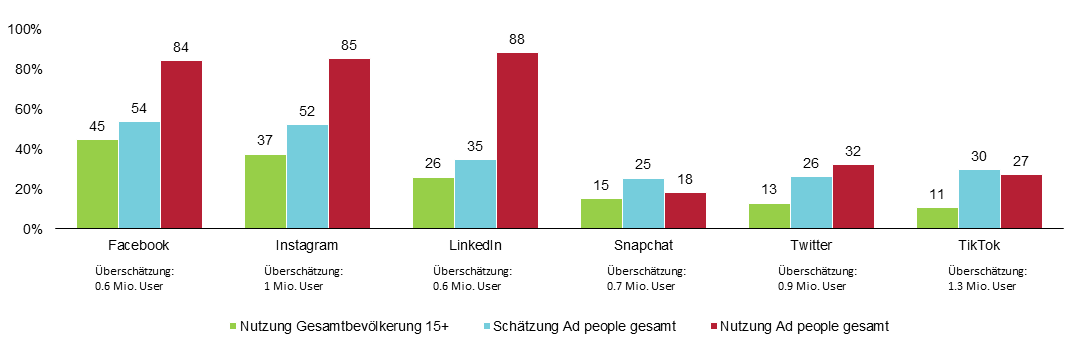
The opposite picture emerges with the newer media (Graphic 2). You may have experienced it the same way in your estimation above, but the Ad People in the study overestimated the general usage of social media in practically all cases. For TikTok, it is 19 percentage points (approx. 1 million users), for Instagram 15 percentage points (1 million) and for LinkedIn 9 percentage points (approx. 600,000). Particularly noticeable here: Ad People not only overestimate the general usage of Facebook and Co., but also use these offers much more than the population.
Graphic 2: Usage and estimation – Social Media
User shares in %
These results inevitably lead to the following conclusion: Due to a different media usage compared to the total population, Ad People come to a distorted estimation of general media usage. Our CMO, Guido Trevisan, says in the Interview mit Persönlich.com:
Anyone who relies on gut feeling as a marketing expert is wrong in the vast majority of cases.
Now one could say: “So what if the professionals are a little off with their assessment”. Could, but shouldn’t. Because this “false” assessment may lead to unfavorable decisions in media planning. And that is exactly the reason why we conducted this study. The results underline once again that it is worth conducting media usage research and using the data for marketing decisions.
Are you interested in the entire study with all the results? Simply download it here:
About the Study
Published on 12.11.2021
Stay Informed
Get valuable insights for your advertising success with the Goldbach Newsletter.
Share this post
Related Articles

The 8th Goldbach Advanced TV Study proves: Connected TV advertising reaches, convinces and activates
08.04.2025

Net Reach also Measurable for Online Video Campaigns
07.04.2025

The Advanced TV study by Goldbach makes it clear: Advertising on Connected TV is becoming increasingly effective.
08.04.2024

Goldbach Video Network: Usage Data 2023
11.07.2023

Advanced TV Study 2023
28.03.2023